One Connected Platform
Collect, analyse and activate real-world audience data, from the sensor on site to the systems your business runs on.
Collect, analyse and activate real-world audience data, from the sensor on site to the systems your business runs on.
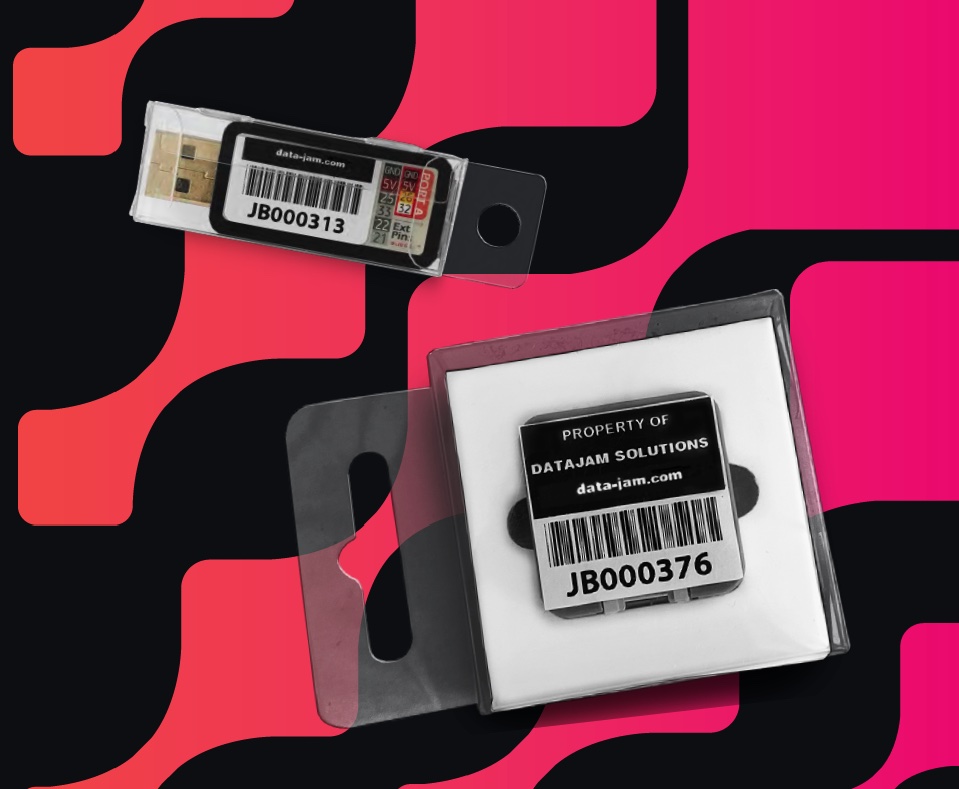
The data-collection layer of the platform. A compact, privacy-first sensor that captures anonymised movement signals across configurable measurement zones at each location.
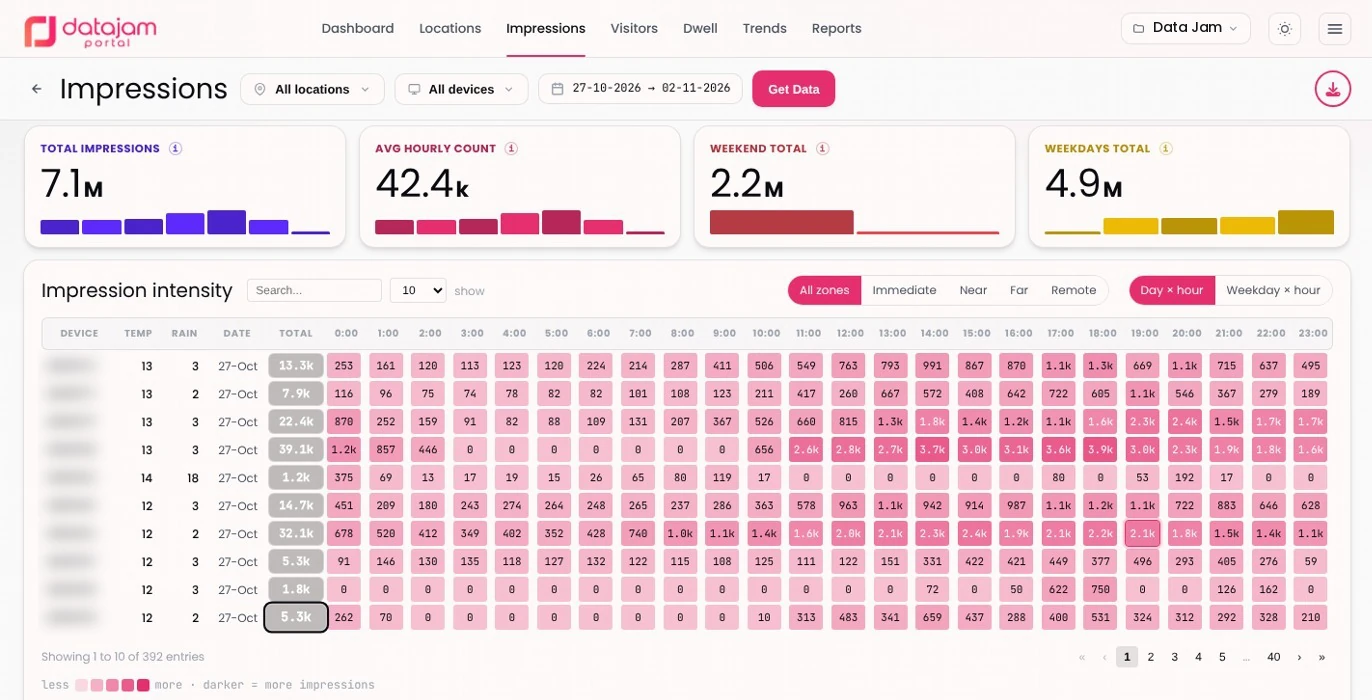
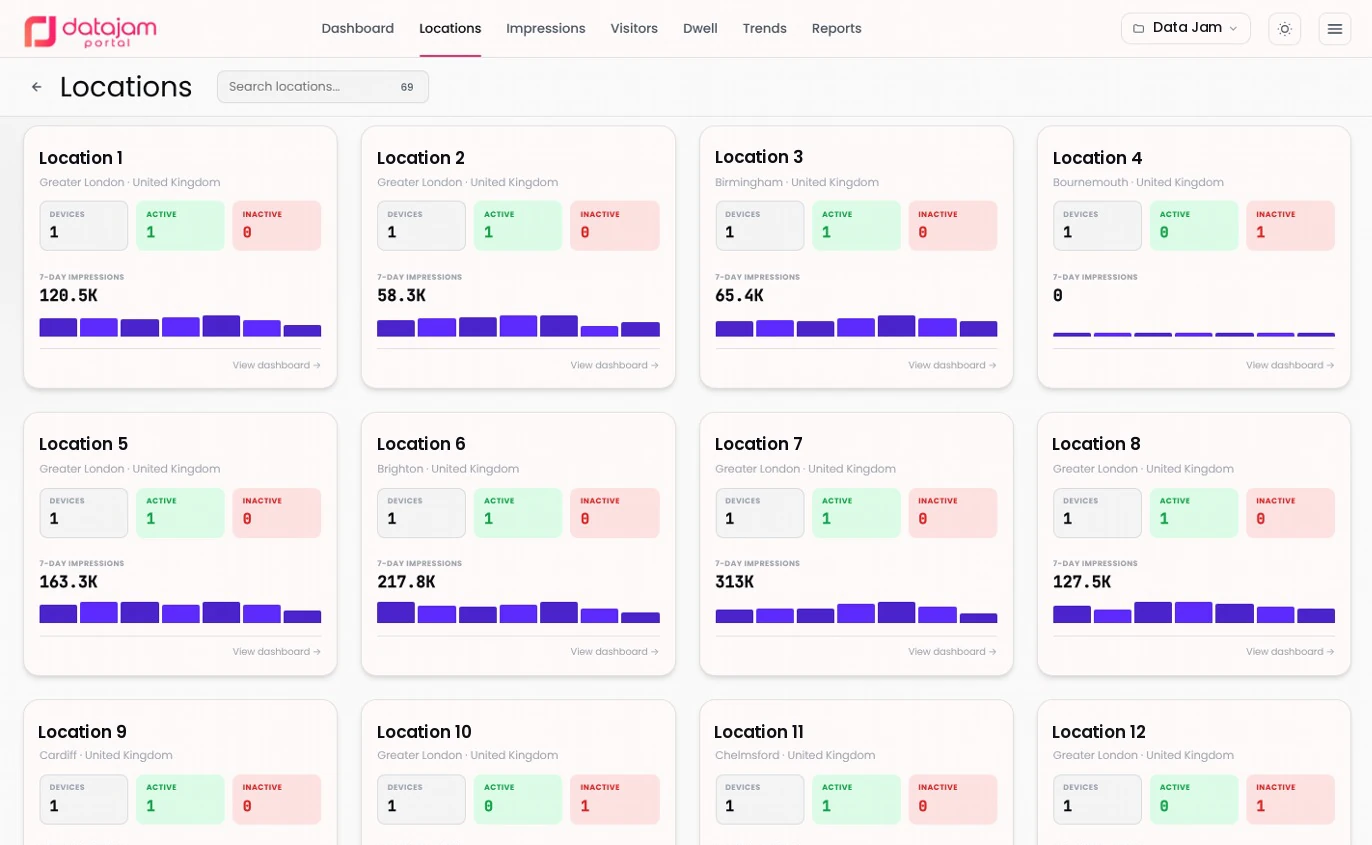
Your command centre for audience data. A card for every location, daily heatmaps with hourly breakdowns, scheduled reports and weather correlation.

Campaign monitoring in real time. Monitor Data Jam-enabled campaigns as they run, with in-flight impressions as they happen, so delivery questions get answered during the campaign, not after it.
Access Campaigns →
From audience data to decisions. PULSE identifies anomalies, detects changes in movement, compares locations, highlights audience peaks and analyses weather and event impacts.
It supports forecasting and generates reporting insights your commercial team can act on.
See PULSE in a demo →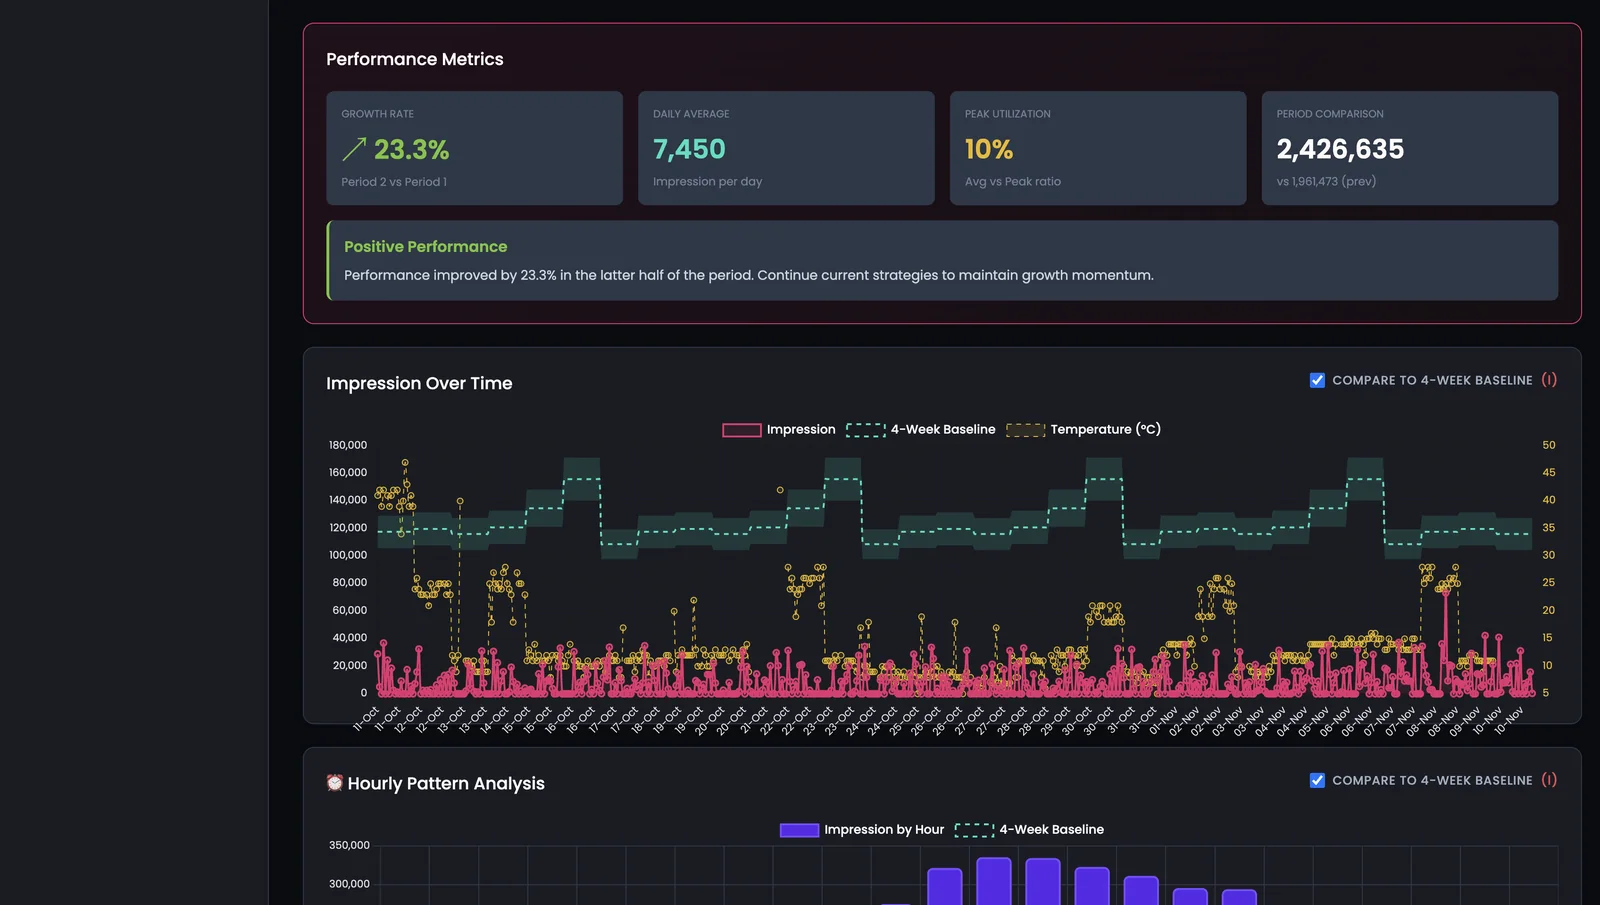
Measurement in public. The Signal is our monthly movement intelligence report on like-for-like trends across matched JamBox locations in the UK.
Every client and partner also receives a bespoke monthly report on their own network.
Read The Signal →Connects Data Jam intelligence to the systems where it needs to work, so measurement drives pricing, programmatic and reporting.
API Documentation Request API access →Location-specific audience measurement grounded in observed movement signals, with privacy built in from the start: no cameras, no personal data.
A live walkthrough of the Portal, Campaigns and PULSE, with your formats and locations in mind.