Movement Intelligence for Out of Home
Understand audience volume, dwell and movement across your network with location-specific data delivered in real time.
Welcome to the
Jam
Understand audience volume, dwell and movement across your network with location-specific data delivered in real time.
Partnering with media owners, venues and brands across the UK, Europe & US
Data Jam turns real-world movement into data you can price, prove and activate.
Location-specific audience volume for every site on your network — measured where your media actually is, not averaged across an area.
See how long audiences stay and how they move through a location, so you can value formats on behaviour, not just presence.
Give advertisers hourly, site-level delivery data they can check against the campaign — proof of performance without the wait.
Push audience data into pricing, programmatic and client systems through the Data Jam API, so measurement drives revenue.
One connected platform for collecting, analysing and activating real-world audience data.
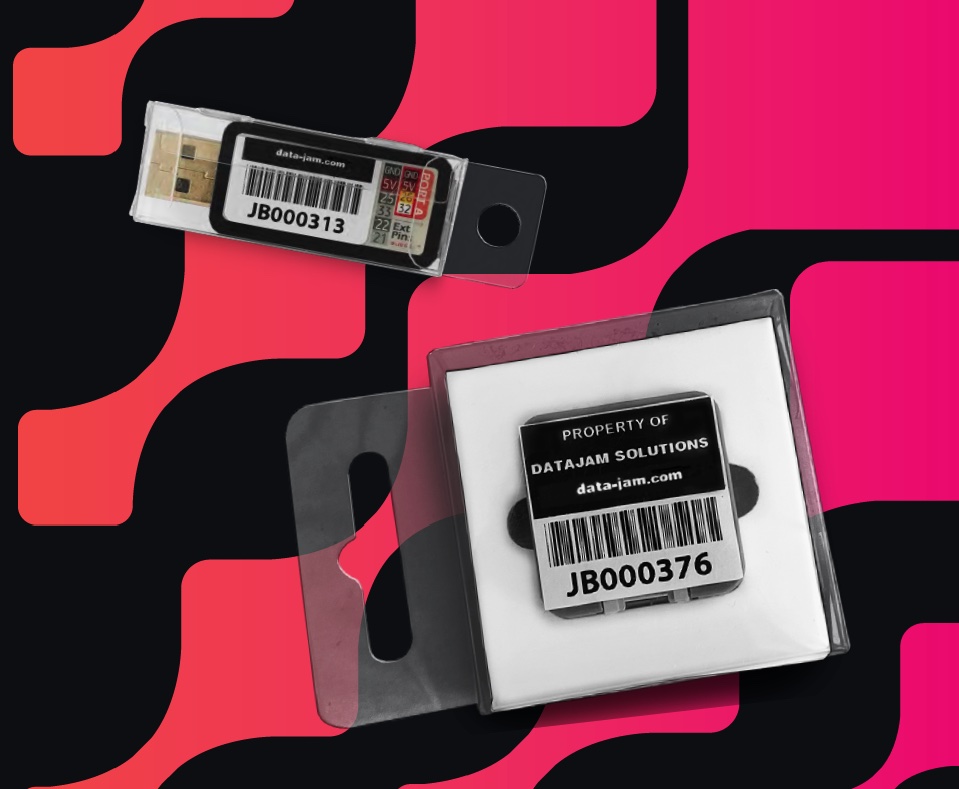
Captures anonymised movement signals at each location. Installs with just power and WiFi, with data flowing in minutes.
About JamBox →Visualises network and location performance in real time.
Identifies trends, anomalies and opportunities in your audience data.
Connects Data Jam intelligence to client systems — SSPs, CMS platforms and your own analytics.
Request API Access →
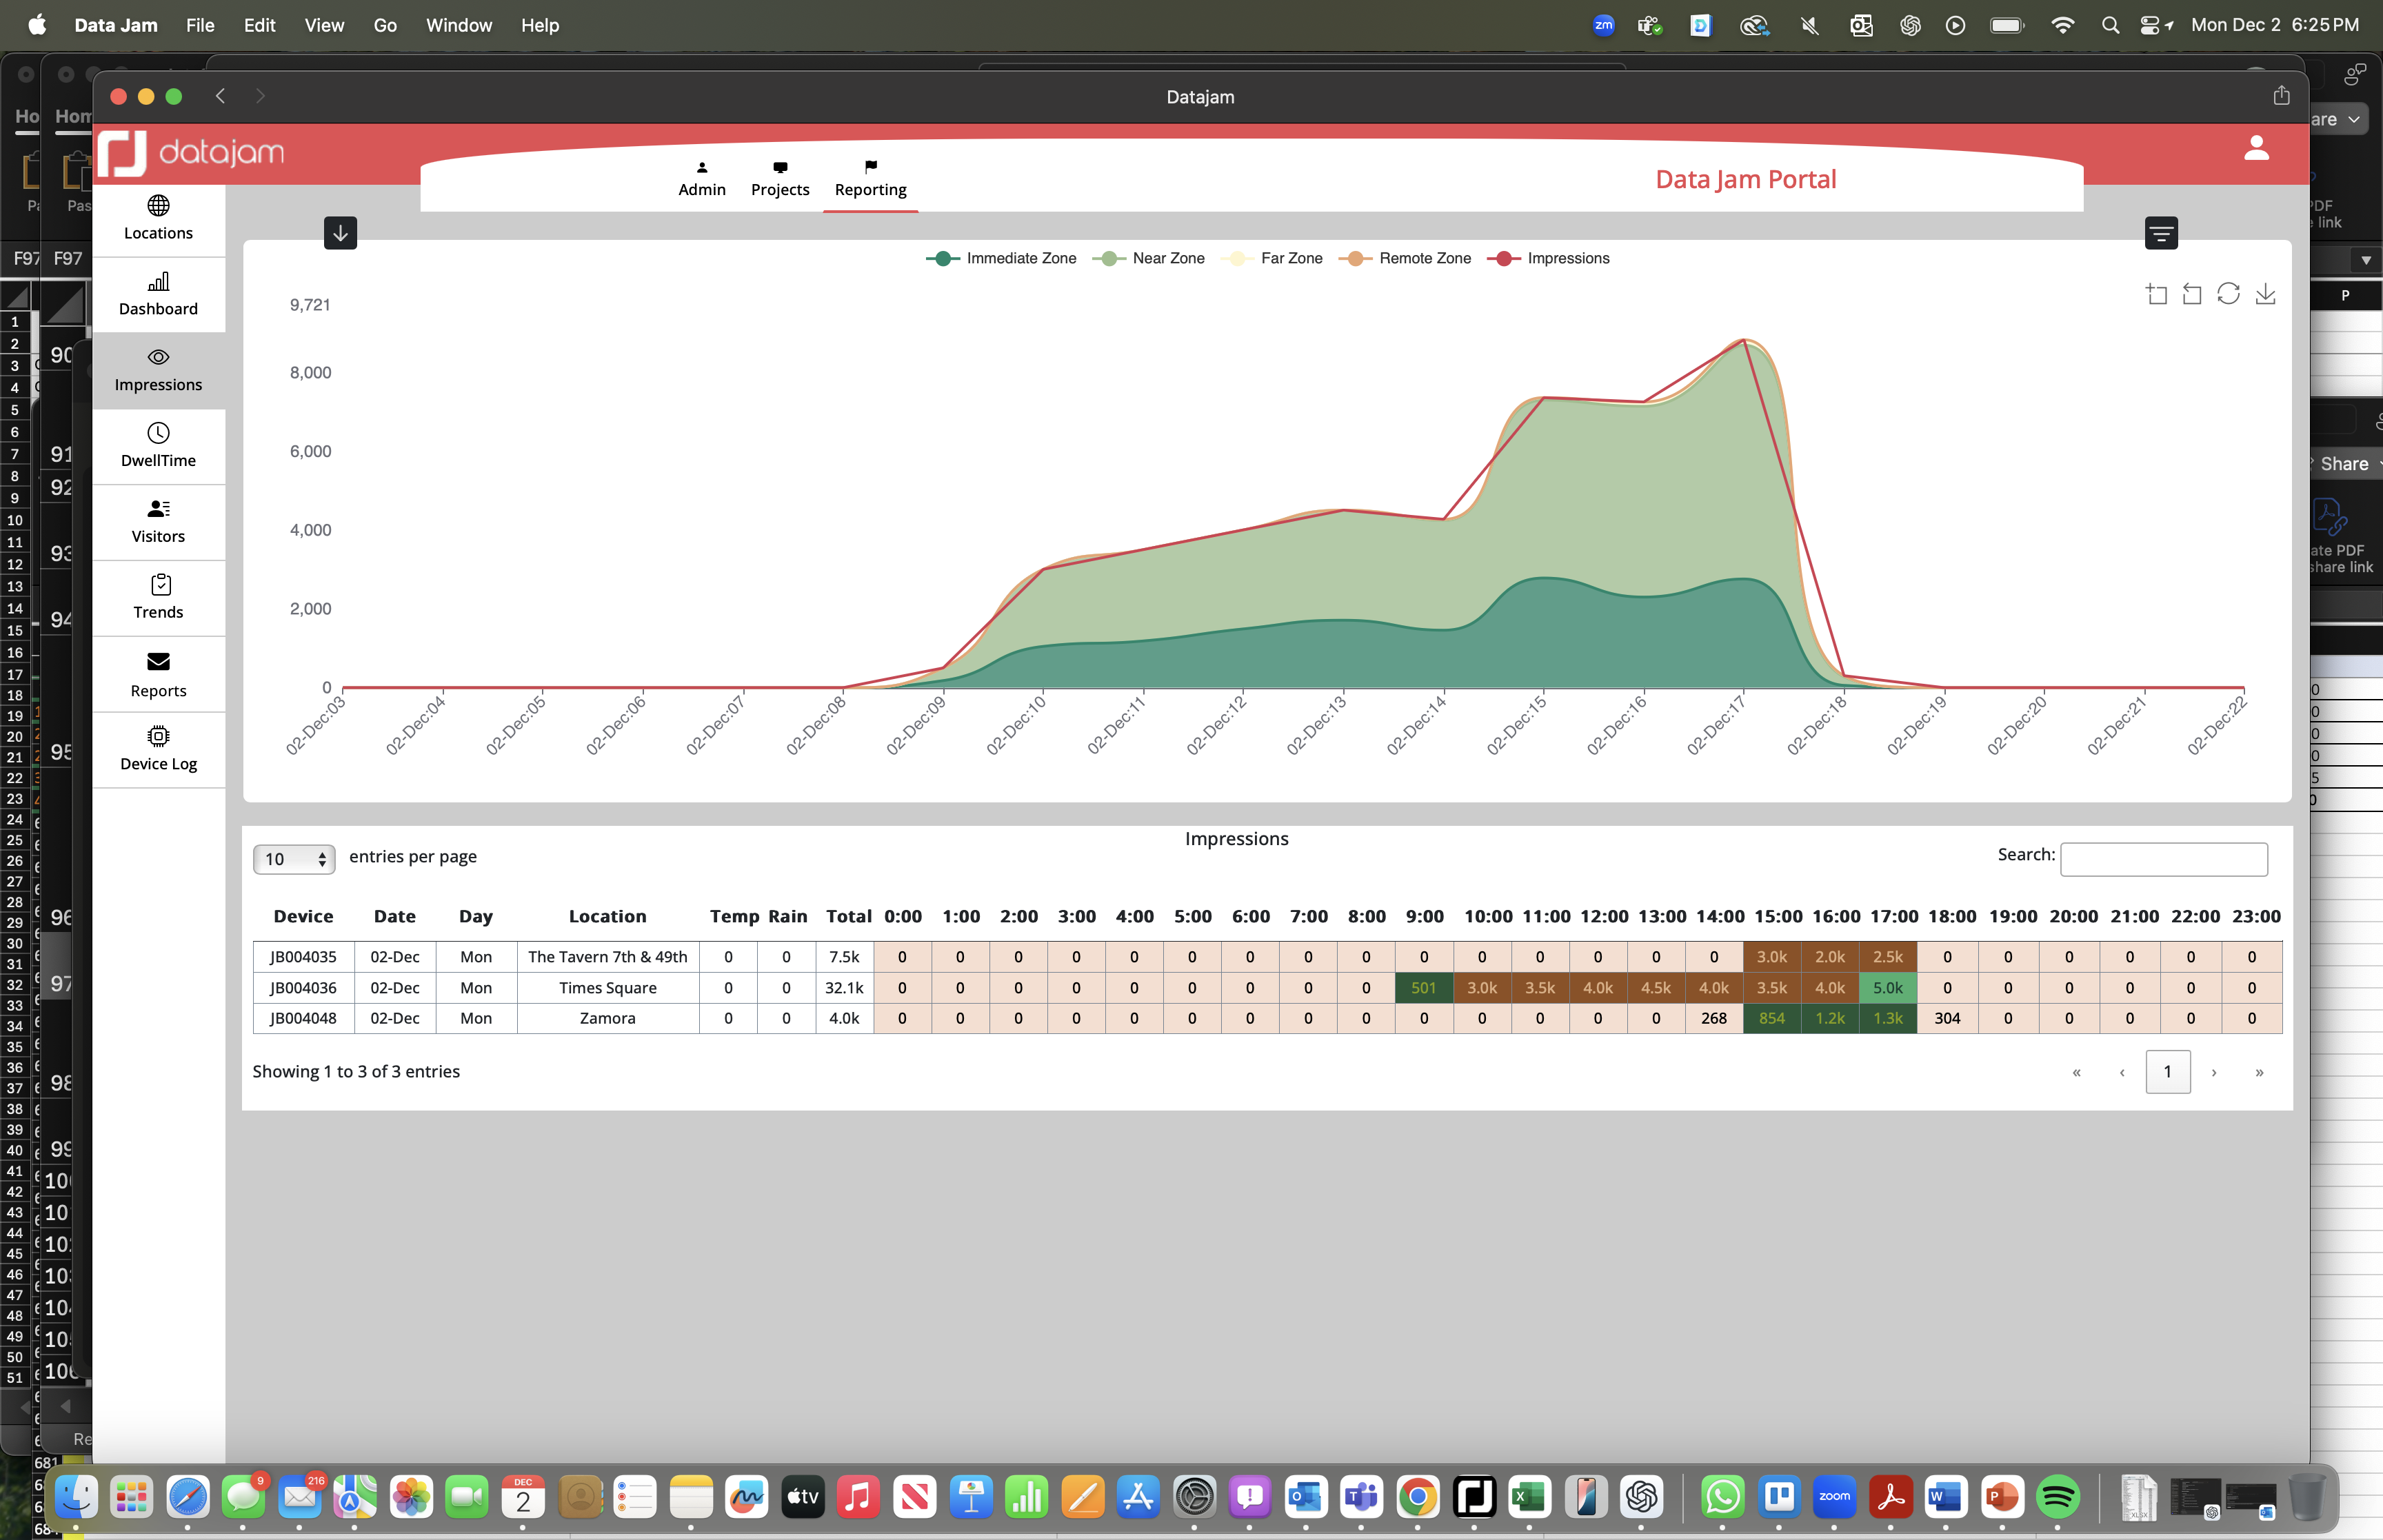
Your command centre — map views, heatmaps, hourly breakdowns and scheduled reports across your network.
Access Portal →
Monitor Data Jam-enabled campaigns in real time — see in-flight impressions as they happen.
Access Campaigns →
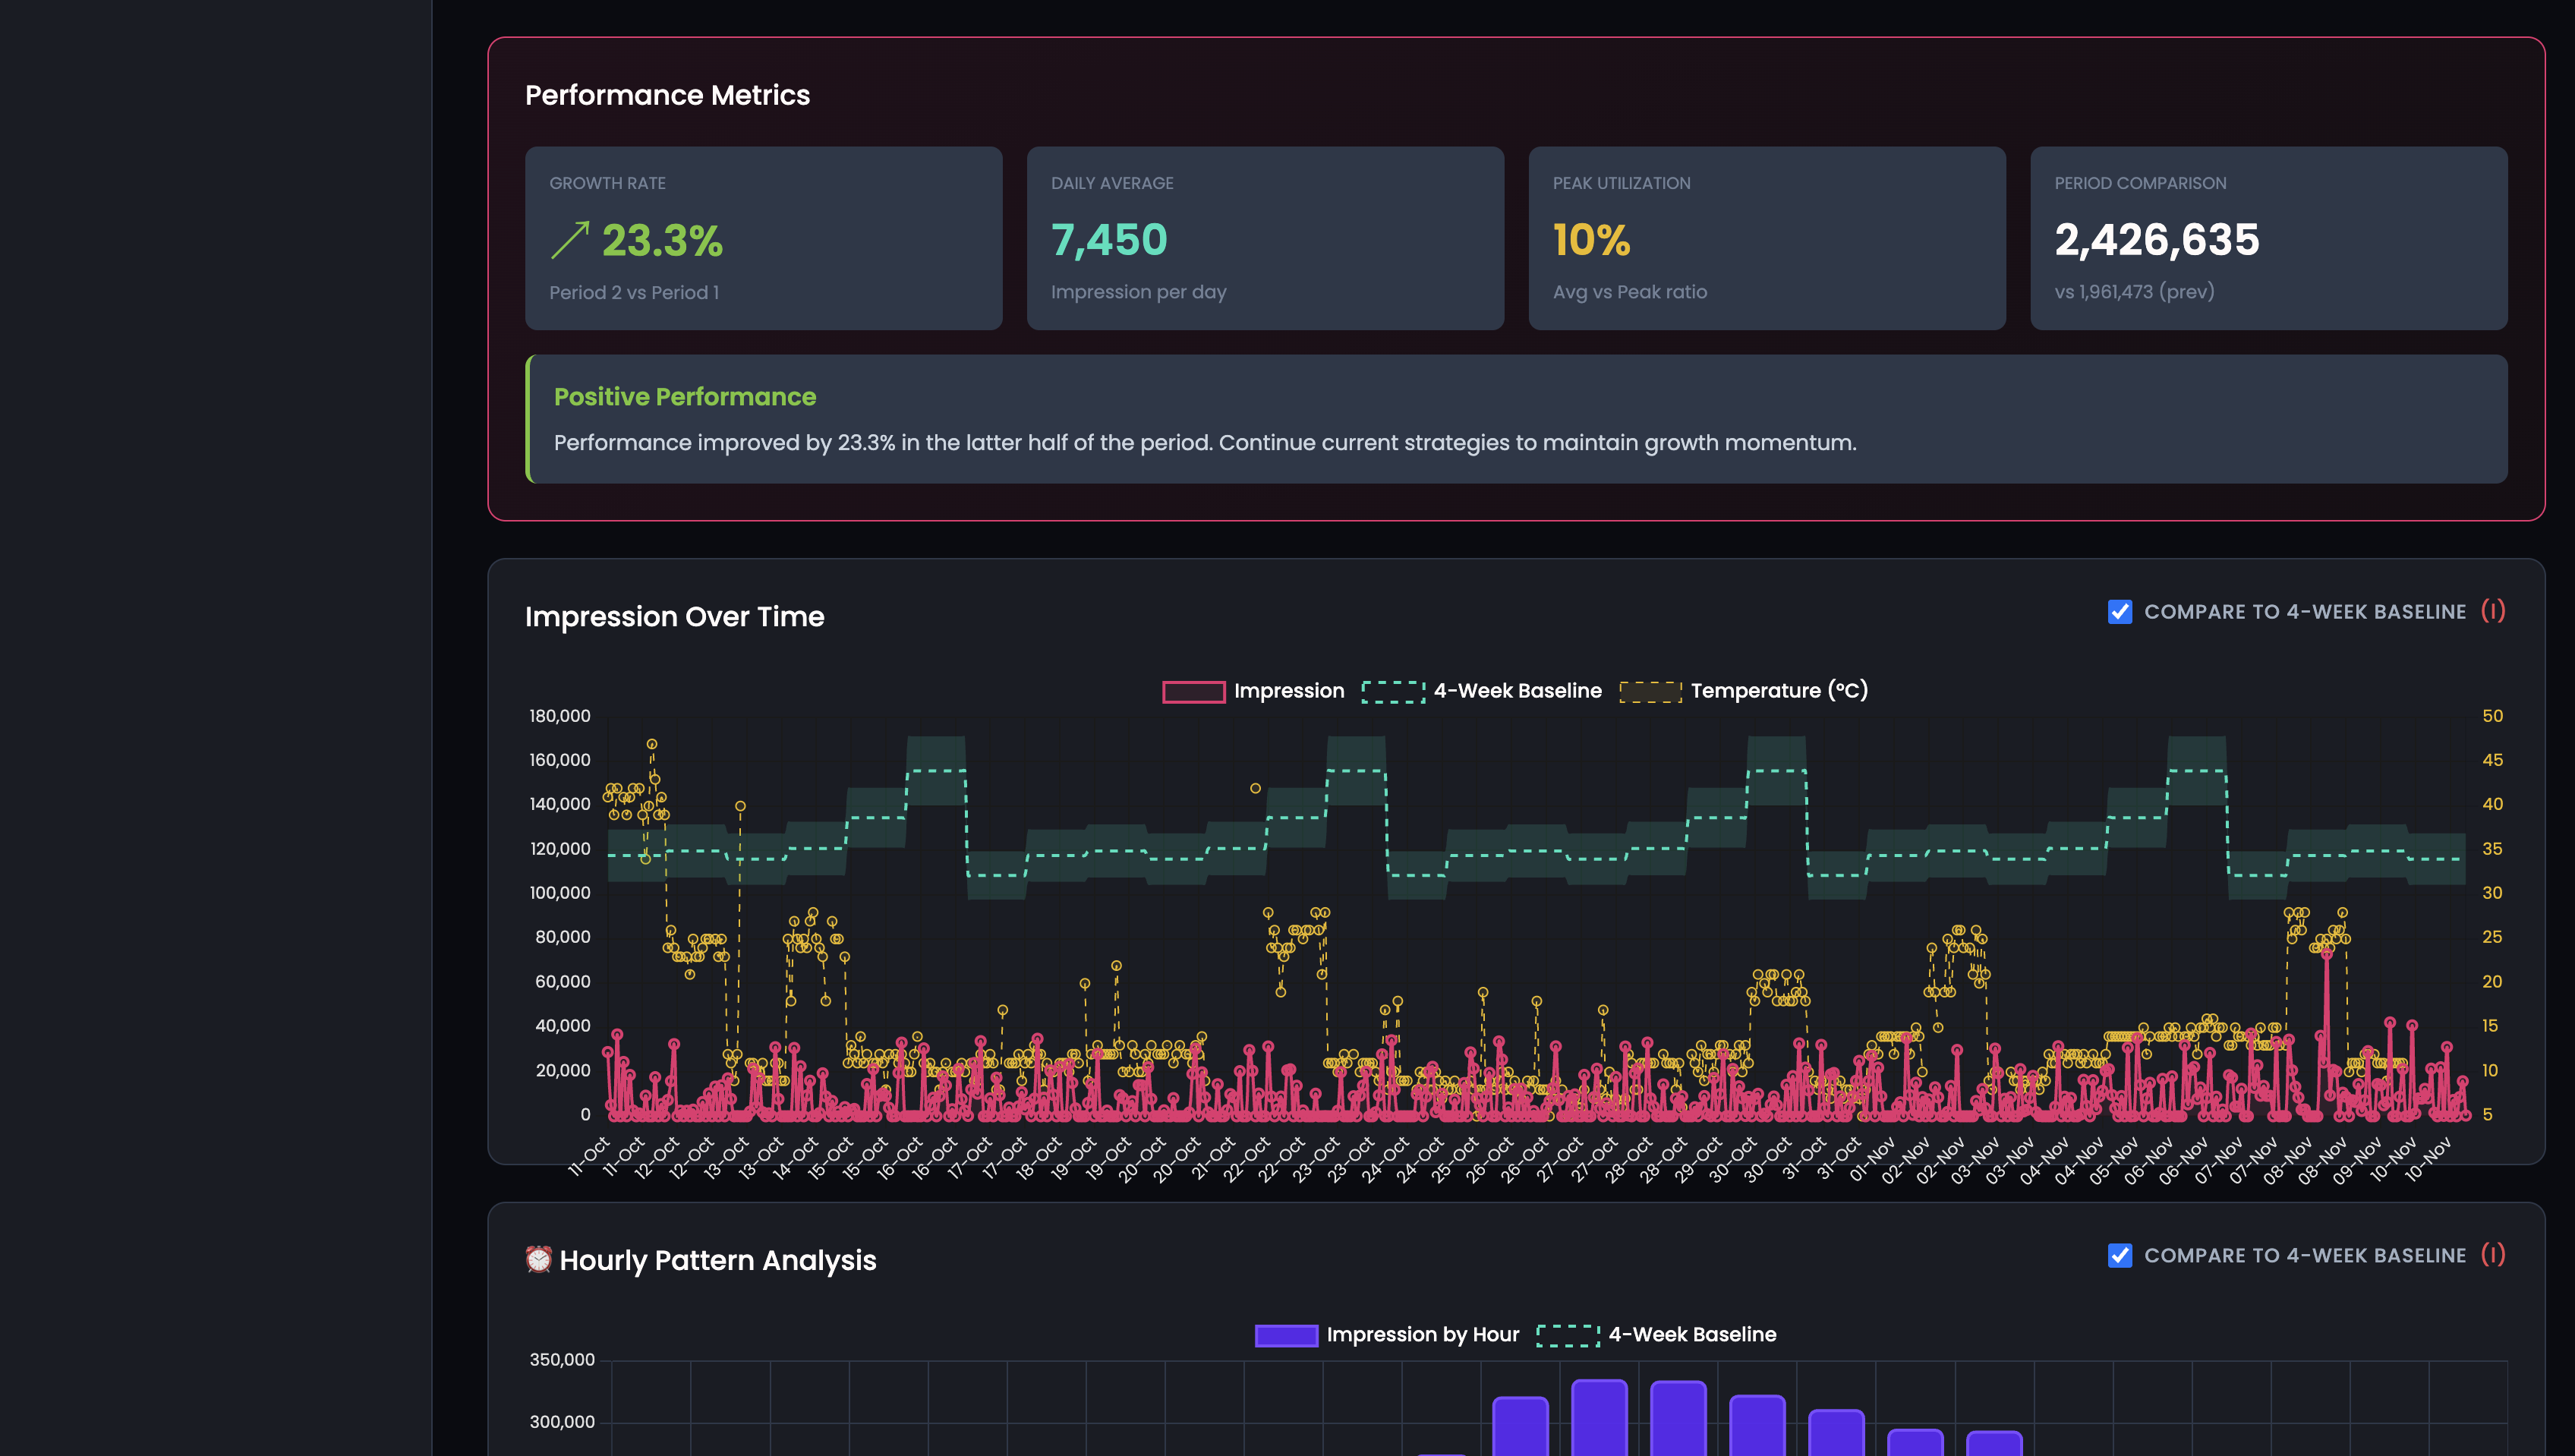
From audience data to decisions — trends, anomalies and opportunities, from audience peaks to weather and event impacts.
About PULSE →
Our monthly movement intelligence report tracking like-for-like trends across the UK — alongside bespoke monthly reports for every client and partner.
Read The Signal →
Portal — real-time dashboards with zone analysis
Portal — interactive map of your whole network
PULSE — from audience data to decisions
The Data-Collection Layer
Where the measurement starts
Every metric on the platform begins with JamBox — compact sensor hardware that captures anonymised movement signals at your locations. Connect power and WiFi, and data starts flowing within minutes.
Movement intelligence organised around your objectives — whatever formats you run.
Price sites and dayparts on measured audience delivery. Weekend, event and seasonal peaks stop being invisible to your rate card.
Share site-level, hour-by-hour audience data with advertisers as campaigns run — proof of performance that wins renewals.
Compare locations, spot underperformers and understand what drives audience at your best sites.
Go beyond counts: see how long audiences stay and how they move, and sell formats on real exposure time.
Feed live audience data into SSPs, CMS platforms and dynamic content via the API.
Deployed across roadside, retail, transport, venues and place-based media.
"Partnering with Data Jam and integrating the JamBox technology into our cinema inventory will provide us with unprecedented insights into our audience. This will enable us to deliver even more value to our clients."
"This cutting-edge technology allows us to deliver up-to-the-minute insights into audience behaviour, format performance and retail trends. This partnership strengthens our position as leaders in retail and destination media."
"Our partnership with Data Jam represents a significant step forward in our commitment to delivering innovative and impactful advertising solutions. We can provide our clients with a deeper understanding of their audience."
"This partnership enables agencies and clients to include our digital OOH screens into their media mix, reaching huge, verified audiences. We now intend to roll this Data Jam tech across our network."
The challenge: a premium retail destination priced on modelled area estimates. The deployment: JamBox measurement at the location, reporting through the Portal in real time.
JamBox measured 200,990 impressions on a Saturday vs. 80,000 estimated by traditional methods
Saturday delivered 74.6% more impressions than Tuesday, proving the value of weekend inventory
Consistent high traffic during retail hours, with lunchtime peaks across all days
Mother's Day weekend showed 50% higher impressions than typical Saturdays
Modelled estimates were significantly understating this premium location — weekend audiences in particular. With measured data, the media owner could price weekend inventory on real delivery and give advertisers site-level proof of performance.
Read the Full Case StudyData Jam provides location-specific audience measurement grounded in observed movement signals rather than generic area averages. Observed movement data is converted into audience metrics through Data Jam's measurement methodology — with privacy built in from the start: no cameras, no personal data, GDPR and CCPA aligned.
How anonymised movement signals become audience volume, dwell and movement metrics — zones, processing and reporting explained.
Read the Methodology →Privacy-first, anonymised signal measurement. GDPR and CCPA guidance, with a Data Protection Impact Assessment (DPIA) available on request.
Privacy Policy →How measurement compares to traditional approaches, what data you receive, and how deployment works.
Read the FAQs →Movement intelligence is location-specific audience measurement grounded in observed movement signals rather than generic area averages. Data Jam measures audience volume, dwell and movement across physical locations and turns that information into data media owners use to price, prove and activate their Out of Home inventory.
JamBox detects anonymised movement signals from mobile devices within configurable measurement zones around a location. Observed movement data is converted into audience metrics through Data Jam's measurement methodology and delivered in real time through the Data Jam Portal and API. Read the full methodology.
Yes. Data Jam uses no cameras and is designed to avoid collection of personal data. Measurement is based on anonymised movement signals, supporting GDPR and CCPA compliant deployment in the UK, Europe and the US. A Data Protection Impact Assessment (DPIA) is available on request.
Data Jam measures audiences across roadside, retail, transport, venues and place-based media — including billboards, transit shelters, street furniture, digital out-of-home (DOOH) screens, shopping centres and other physical environments where audiences move.
Traditional OOH measurement typically relies on periodic surveys and statistical models that describe broad areas. Data Jam provides location-specific audience measurement grounded in observed movement signals at each site, delivered in real time rather than in monthly or quarterly reports. Learn more about movement intelligence.
Data is available in real time through the Data Jam Portal — with map views, heatmaps, hourly breakdowns and scheduled reports — and programmatically via the Data Jam API for integration with SSPs, CMS platforms and client systems. PULSE adds analytics that surface trends, anomalies and opportunities.
The Signal — Data Jam's monthly movement intelligence reports and industry perspectives.
+19.6% like-for-like growth across 777 matched locations — and the month closed on the three biggest days we've ever measured, peaking at a record 16.4M.
Read More →
A reported 1.5 million people came out for Arsenal's Champions Parade. Our network measured 5x a normal Sunday all day, peaking at 6.7x as the parade passed.
Read More →
+23.2% like-for-like growth across 700 matched locations — with every day of the week up at least 20%.
Read More →See the platform in action. Our team will show you what movement intelligence looks like on your own network.
Get in touch and we'll schedule a personalised demo for your team.
Book a DemoOr email us directly at hello@data-jam.com